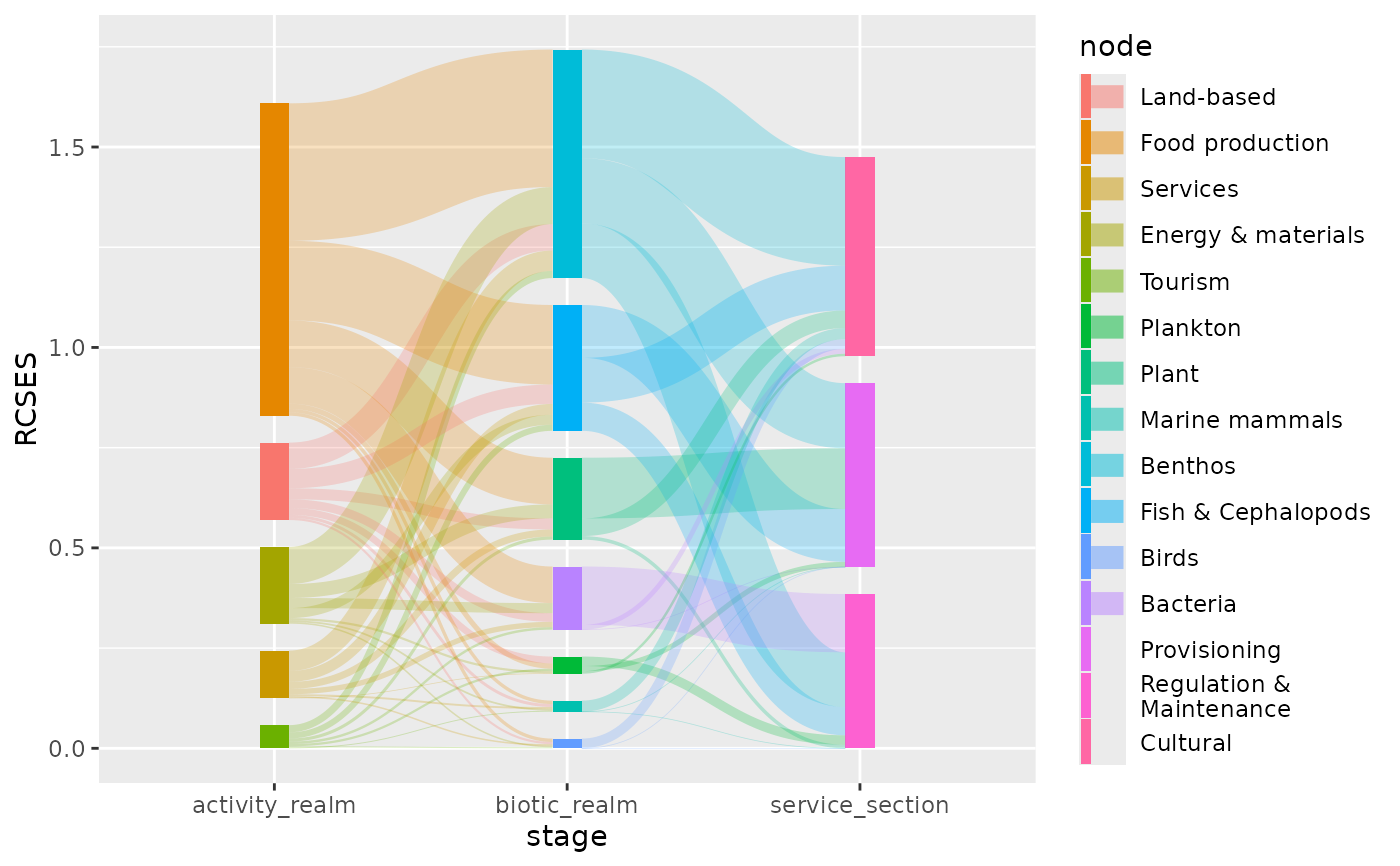
In a Sankey diagram nodes are depicted as stacked bars, possibly with
vertical spacing between them. Use geom_sankeynode() to add nodes to
your Sankey diagram. If you combine the nodes with geom_sankeyedge(),
make sure that both use the same position object.
Usage
GeomSankeynode

geom_sankeynode(
  mapping = NULL,
  data = NULL,
  stat = "sankeynode",
  position = "sankey",
  na.rm = FALSE,
  show.legend = NA,
  width = "auto",
  align = c("bottom", "top", "center", "justify"),
  order = c("ascending", "descending", "ascending+", "descending+", "as_is"),
  h_space = "auto",
  v_space = 0,
  nudge_x = 0,
  nudge_y = 0,
  split_nodes = FALSE,
  split_tol = 0.001,
  direction = c("forward", "backward"),
  inherit.aes = TRUE,
  ...
)
Format
An object of class GeomSankeynode (inherits from GeomBar, GeomRect, Geom, ggproto, gg) of length 6.
Arguments
- mapping
Set of aesthetic mappings created by
aes(). If specified andinherit.aes = TRUE(the default), it is combined with the default mapping at the top level of the plot. You must supplymappingif there is no plot mapping.- data
The data to be displayed in this layer. There are three options:
If
NULL, the default, the data is inherited from the plot data as specified in the call toggplot().A
data.frame, or other object, will override the plot data. All objects will be fortified to produce a data frame. Seefortify()for which variables will be created.A
functionwill be called with a single argument, the plot data. The return value must be adata.frame, and will be used as the layer data. Afunctioncan be created from aformula(e.g.~ head(.x, 10)).- stat
The statistical transformation to use on the data for this layer. When using a
geom_*()function to construct a layer, thestatargument can be used to override the default coupling between geoms and stats. Thestatargument accepts the following:A
Statggproto subclass, for exampleStatCount.A string naming the stat. To give the stat as a string, strip the function name of the
stat_prefix. For example, to usestat_count(), give the stat as"count".For more information and other ways to specify the stat, see the layer stat documentation.
- position
A position adjustment to use on the data for this layer. This can be used in various ways, including to prevent overplotting and improving the display. The
positionargument accepts the following:The result of calling a position function, such as
position_jitter(). This method allows for passing extra arguments to the position.A string naming the position adjustment. To give the position as a string, strip the function name of the
position_prefix. For example, to useposition_jitter(), give the position as"jitter".For more information and other ways to specify the position, see the layer position documentation.
- na.rm
If
FALSE, the default, missing values are removed with a warning. IfTRUE, missing values are silently removed.- show.legend
logical. Should this layer be included in the legends?
NA, the default, includes if any aesthetics are mapped.FALSEnever includes, andTRUEalways includes. It can also be a named logical vector to finely select the aesthetics to display. To include legend keys for all levels, even when no data exists, useTRUE. IfNA, all levels are shown in legend, but unobserved levels are omitted.- width
Width of the node (
numeric). Whensplit_nodesis set toTRUEeach part of the split node will have half this width. Use"auto"to automatically determine a suitable width.- align
A
characterthat indicates how the nodes across the stages are aligned. It can be any of"top","bottom","center"or"justify".- order
A
characterindicating the method to be used for the order of stacking nodes and edges in a plot. Should be one of:ascending(default), sorts nodes and edges from large to small (largest on top);descendingsorts nodes and edges from small to large (smallest on top);ascending+Same asascendingbut it also arranges edges and nodes by its aesthetics;descending+Same asdescendingbut it also arranges edges/nodes by its aesthetics;as_iswill leave the order of nodes and edges as they are indata.You can also provide a custom function to control the stacking order of nodes and edges. The function needs to accept one argument (
data) which can be either nodes or edges data. The function needs to add a column namednode_ordercontaining numbers by which the nodes need to be ordered. In case of edges you need to add two columns. One namededge_order, controlling the order of outgoing edges, and one namededge_order_endcontrolling the order of incoming edges. For more details seevignette("stacking_order").- h_space
Horizontal space between split nodes (
numeric). This argument is ignored whensplit_nodes == FALSE. Use"auto"to automatically position split nodes.- v_space
Vertical space between nodes (
numeric). When set to zero (0), the Sankey diagram becomes an alluvial plot. Use"auto"to automatically determine a suitable vertical space.- nudge_x, nudge_y
Horizontal and vertical adjustment to nudge items by. Can be useful for offsetting labels.
- split_nodes
A
logicalvalue indicating whether the source and destination nodes should be depicted as separate boxes.- split_tol
When the relative node size (resulting source and destination edges) differs more than this fraction, the node will be displayed as two separate bars.
- direction
One of
"forward"(default) or"backward". When set to"backward"the direction of the edges will be inverted. In most cases this parameter won't affect the plot. It can be helpful when you want to decorate the end of an edge (instead of the start; see examples).- inherit.aes
If
FALSE, overrides the default aesthetics, rather than combining with them. This is most useful for helper functions that define both data and aesthetics and shouldn't inherit behaviour from the default plot specification, e.g.annotation_borders().- ...
Other arguments passed on to
layer()'sparamsargument. These arguments broadly fall into one of 4 categories below. Notably, further arguments to thepositionargument, or aesthetics that are required can not be passed through.... Unknown arguments that are not part of the 4 categories below are ignored.Static aesthetics that are not mapped to a scale, but are at a fixed value and apply to the layer as a whole. For example,
colour = "red"orlinewidth = 3. The geom's documentation has an Aesthetics section that lists the available options. The 'required' aesthetics cannot be passed on to theparams. Please note that while passing unmapped aesthetics as vectors is technically possible, the order and required length is not guaranteed to be parallel to the input data.When constructing a layer using a
stat_*()function, the...argument can be used to pass on parameters to thegeompart of the layer. An example of this isstat_density(geom = "area", outline.type = "both"). The geom's documentation lists which parameters it can accept.Inversely, when constructing a layer using a
geom_*()function, the...argument can be used to pass on parameters to thestatpart of the layer. An example of this isgeom_area(stat = "density", adjust = 0.5). The stat's documentation lists which parameters it can accept.The
key_glyphargument oflayer()may also be passed on through.... This can be one of the functions described as key glyphs, to change the display of the layer in the legend.
Value
Returns a ggplot2::layer() which can be added to a ggplot2::ggplot()
Details
This ggplot2 layer depicts the size of all connected edges as a bar. The height of
of each bar is determined by the sum of y aesthetic in each group. When the sum of edges
that flow to a bar differ more than split_tol compared to the edges that flow from the
same node, a vertical split is introduced in the node.
Aesthetics
geom_sankeynode() understands the following aesthetics (required aesthetics
are in bold)

x: Works for variables on a discrete scale. Might work for continuous variables but is not guaranteed. This variable is used to distinguish between stages in the Sankey diagram on the x axis.y: A continuous variable representing the width of the edges in a Sankey diagram.group: A discrete variable used for grouping edges to nodes in each stage. Essentially it is an identifier for the nodes.connector: Indicates which side of an edge is reflected by the corresponding record. Should be one of"from"or"to".edge_id: A unique identifier value for each edge. This identifier is used to link specific"from"and"to"records in an edge (flow).fill: see
vignette("ggplot2-specs", "ggplot2")colour: see
vignette("ggplot2-specs", "ggplot2")linetype: see
vignette("ggplot2-specs", "ggplot2")linewidth: see
vignette("ggplot2-specs", "ggplot2")alpha: A variable to control the opacity of an element.